2.13 Data Center
2.13 Data Center
The data center supports centralized display and management of real-time and history monitoring points. Real-time data provides two modules: [Data Record] and [Data Meter]. The functions are basically the same, but the display methods are different. [Historical Record] module is for quickly querying the historical data of all devices under the account.
2.13.1 Data record
This page allows users to assign real-time monitoring points of the V-Box or HMI. The page is displayed and viewed in the form of a list, as shown in the figure below.

(1) Group management
Supports user group management of monitoring points. Click the icon button in the upper right corner of the page to open the group management pop-up window. Supports creation, editing and deletion of groups. As shown in the figure below.

Information
Note: If monitoring points have been assigned to a group, the assigned monitoring points will also be deleted after the group is deleted.
(2) Assign monitoring points
Click the "Assign tags" button to add monitoring points to the page for custom display under the group. After opening the pop-up window, select the device, real-time monitoring point group, and check the device. After checking, all the checked monitoring point sets will be displayed on the right. After selecting, click "OK" to add. As shown in the figure below.

(3) Copy, Move monitoring tag
Allow users to copy or move the monitoring points under the current group to other groups, as shown in the figure below, just select the target group.

2.13.2 Historical record
This page allows users to view the historical monitoring point data of the V-Box or HMI under the account. It supports the query of historical monitoring point data across devices, but only for devices of the same type (the same type here refers to V-Box or HMI), and supports exporting historical monitoring point data into Excel tables, as shown in the figure below.
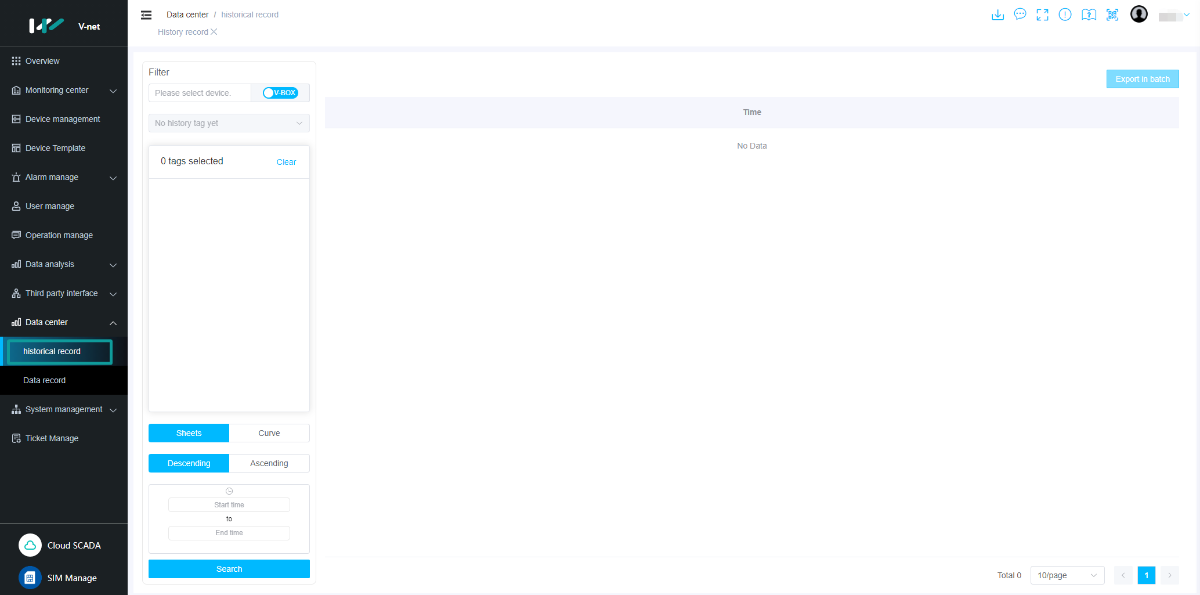
(1) Historical monitoring point data query
Select the device, as shown in the figure below.

After the device selection is completed, click the historical monitoring point cascade selector below, which supports multiple selections, as shown in the figure below.
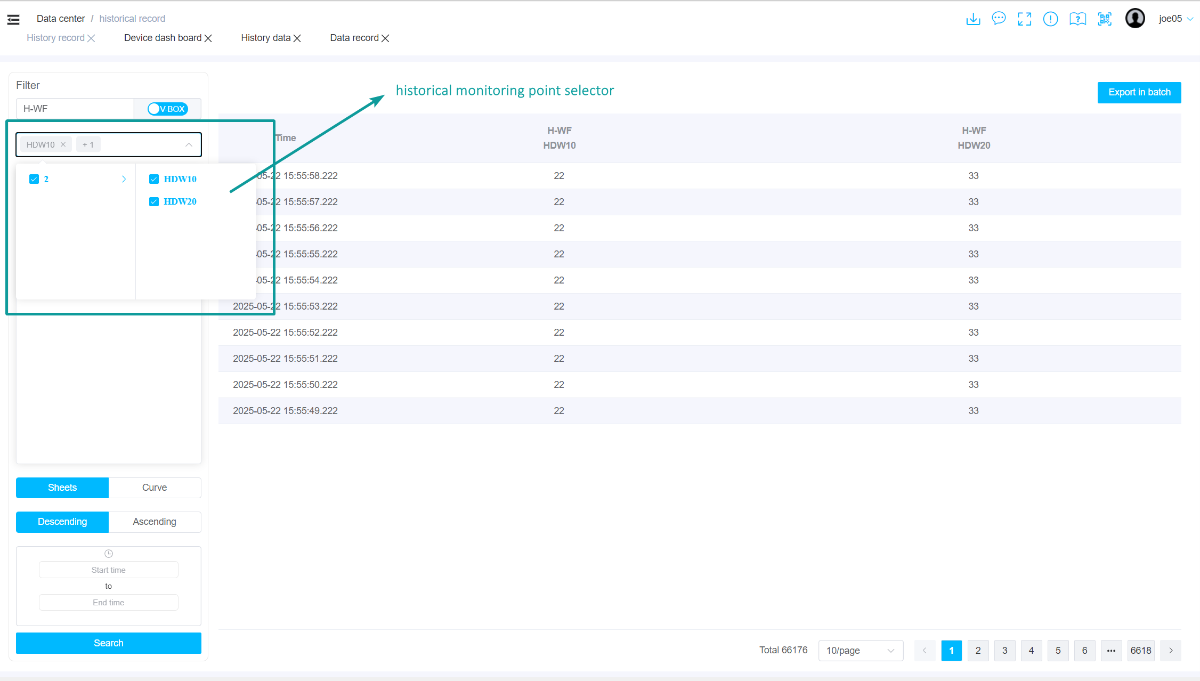
The selected historical monitoring point will appear below the historical monitoring point cascade selector. A maximum of 16 historical monitoring points can be selected, as shown in the figure below.
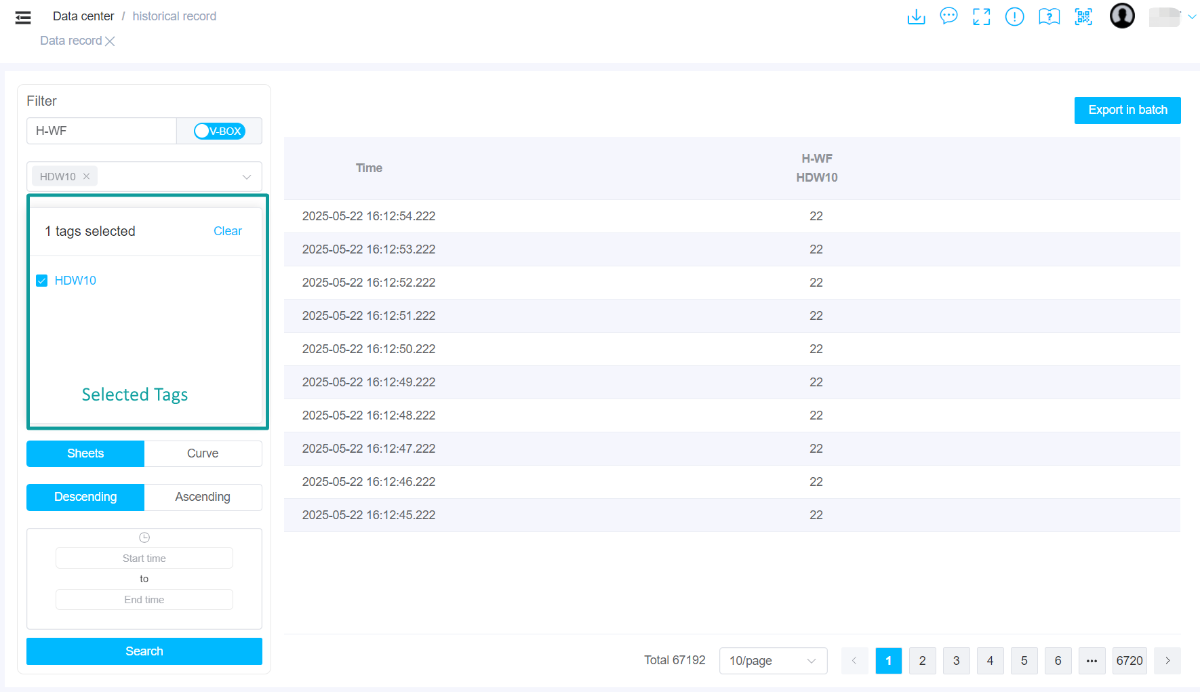
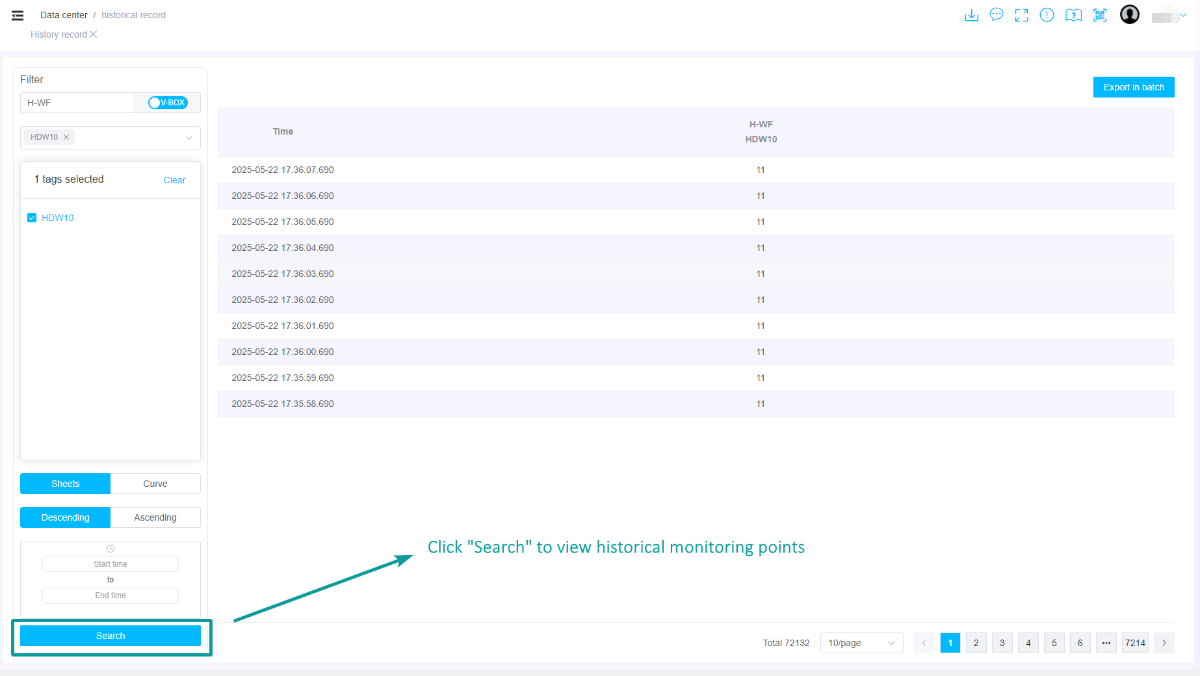
After selecting the monitoring point, click the [Search] button to query the data of the historical monitoring point, as shown in the figure below.
Click the [Curve] button in the lower left corner to change the display format of historical monitoring point data from a table to a line graph, as shown in the following figure.

If you want to select the historical monitoring points of other devices of the same type, reselect the device to enter the historical monitoring point selection of the new device. The selected historical monitoring points of the previously selected device will not be cleared.
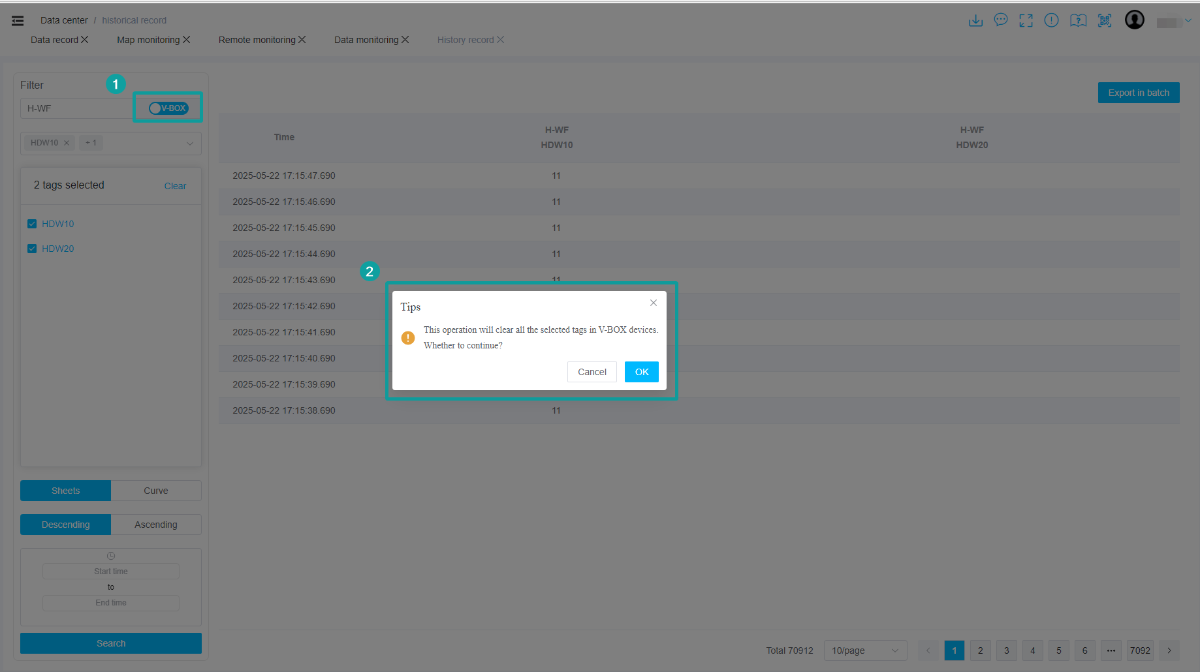
If you want to view the historical monitoring points of another type of device, you need to click ![]() to clear monitoring points to switch the device type, as shown in the figure below.
to clear monitoring points to switch the device type, as shown in the figure below.
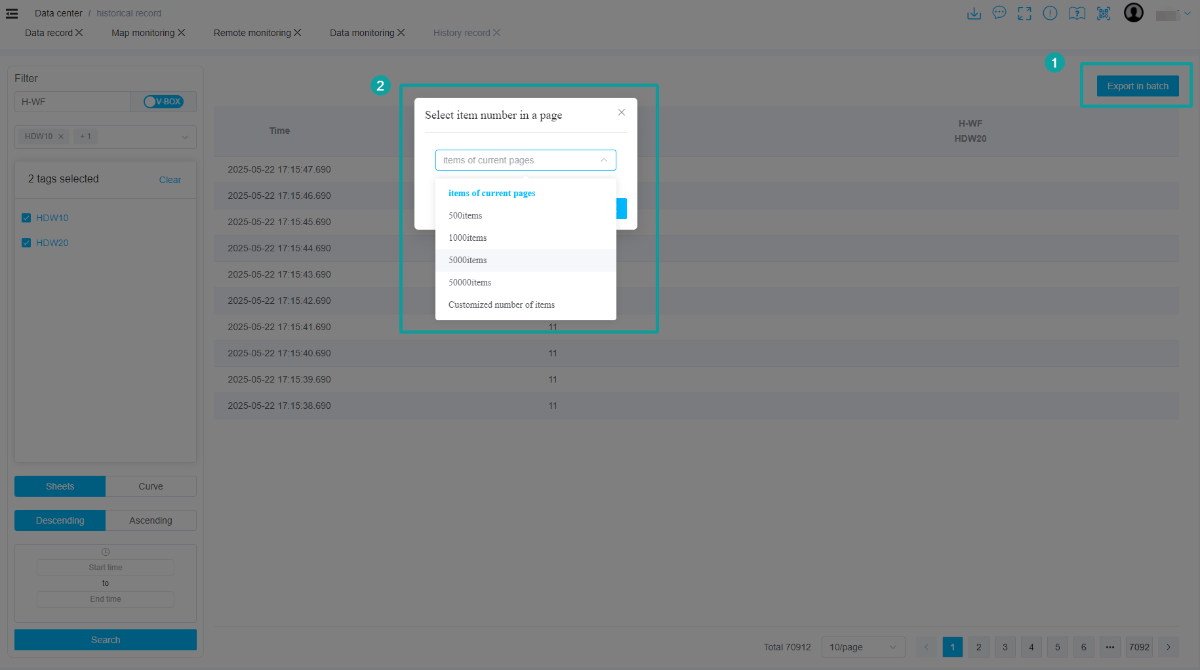
(2) Export excel table
Click the [Export in batch] in the upper right corner to enter the pop-up window for setting the number of exported data items. After confirming the number of exported data items, click the [OK] button to export the Excel table of historical monitoring points, as shown in the figure below.